Home  /  Articles  /  S‑meter and decibels

Article · measurements

The S‑meter lies.
Decibels don’t.

“You’re 59” is heard on the air more often than “good morning”. But what does that nine actually mean? I show how many microvolts S9 is, why two radios show the same signal differently, what 100 W instead of 5 W really gives you, and how to check your own S‑meter in a quarter of an hour. Plus a calculator that converts dBm, microvolts, watts and S‑units both ways.

1 S = 6 dB S9 HF = −73 dBm S9 VHF = −93 dBm kT = −174 dBm/Hz
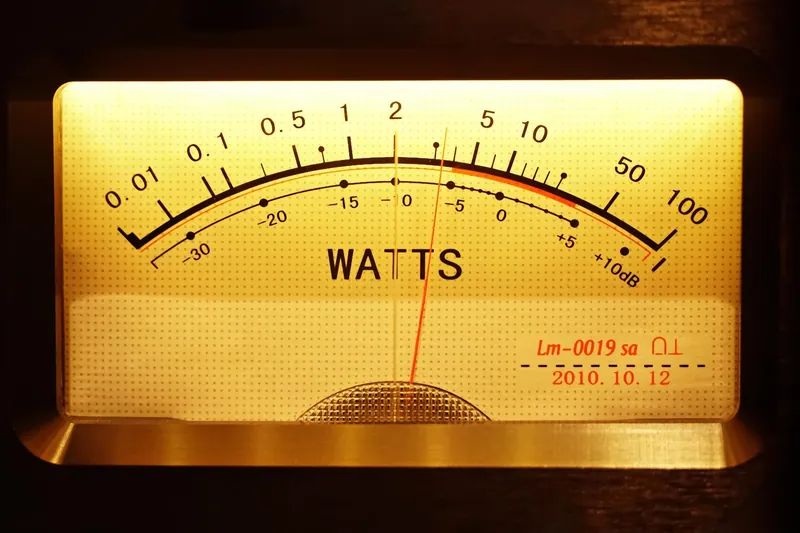
Illuminated power meter with a curved scale from 0.01 to 100 W and a second scale in decibels from −30 to +10 dB, the red needle points to 3 W Scale in watts and decibels
Decibels without fear

Three numbers that will do

A decibel isn’t a unit, it’s the logarithm of the ratio of two powers. Sounds scary, but in everyday amateur radio you only need to remember three numbers and one rule: you add decibels instead of multiplying.

3dB
× 2 power

Doubling the power. Going from 100 W to 200 W gets you only 3 dB — half an S‑meter division. Your correspondent will barely notice.

6dB
× 4 power · × 2 voltage

Exactly one S‑unit. For your correspondent’s S‑meter to move by one mark, you must quadruple your power or use an antenna with 6 dB gain.

10dB
× 10 power

Ten times the power. Every additional 10 dB adds another zero: 20 dB = 100 times, 30 dB = 1000 times. That’s why going from 100 W to 1 kW gives you just under two divisions.

dB, dBm, dBW, dBi — four different things

dB only says “how many times”. It’s the letter after it that gives a reference and turns a decibel into an actual value.

  • dBm — power referenced to 1 mW. 0 dBm is 1 mW, +30 dBm is 1 W, +50 dBm is 100 W. We also quote receiver input levels like this: S9 on HF is −73 dBm.
  • dBW — the same referenced to 1 W. 100 W = 20 dBW = 50 dBm. The difference between dBW and dBm is always 30.
  • dBi and dBd — antenna gain relative to an isotropic radiator or a half‑wave dipole. A dipole is 2.15 dBi, so 0 dBd = 2.15 dBi. When a datasheet just says “dB”, check whether it means dBi or dBd — that’s a 2.15 dB difference.
  • dBµV — voltage relative to 1 µV. At a 50 Ω input: 0 dBµV = −107 dBm.

The key rule: you add decibels. Radio 50 dBm, coax −2 dB, antenna +6 dBi — what goes on the air is 54 dBm, roughly 250 W effective isotropic radiated power (EIRP). No calculator.
Power ladder in decibels A vertical scale from plus 60 to minus 150 dBm. At the top, transmitter powers: 1 kW is plus 60 dBm, 100 W plus 50 dBm, 5 W plus 37 dBm. At the bottom, received levels: S9 on HF minus 73 dBm, S9 on VHF minus 93 dBm, S1 on HF minus 121 dBm, and thermal noise in a 2.4 kHz bandwidth about minus 140 dBm. Between a 100 W transmitter and an S9 signal there are 123 dB. +60 +40 +20 0 −20 −40 −60 −80 −100 −120 −140 dBm 1 kW +60 dBmpower amplifier 100 W +50 dBmtypical HF transceiver 5 W +37 dBmhandheld 1 W +30 dBm 1 mW 0 dBmzero point of the dBm scale S9+40 −33 dBmvery strong HF station S9 on HF −73 dBm50 µV on 50 Ω S9 on VHF −93 dBm5 µV on 50 Ω S1 on HF −121 dBm0.2 µV kTB noise −140.2 dBmin a 2.4 kHz bandwidth 123 dB = 2 trillion times
Between a 100 W transmitter (+50 dBm) and an S9 signal on HF (−73 dBm) there are 123 dB. Written in watts that’s 100 W and 0.00000000005 W — which is why hams do the maths in decibels.
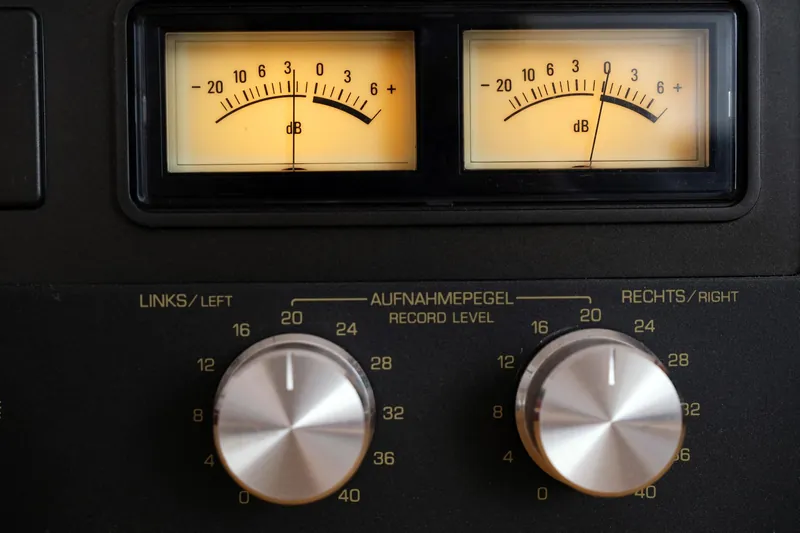
Two illuminated tape deck VU meters with a decibel scale from −20 to +6 dB, with recording level knobs below Level meters in decibels: 0 dB is the reference, the rest is “how many times”
Convention, not a law of physics

The S scale according to the IARU

For decades every manufacturer drew the scale their own way. IARU Region 1, our region covering Europe, Africa and the Middle East, set out to bring order.

Technical Recommendation R.1

The need to standardise the scale was raised at the IARU Region 1 conference in Hungary in 1978, and the recommendation was formally adopted in Brighton in 1981. It says four things:

  • One S‑unit is 6 dB, i.e. twice the voltage and four times the power.
  • Below 30 MHz S9 = −73 dBm of available power from a generator connected to the antenna socket. On 50 Ω that is 50 µV.
  • From 144 MHz upwards S9 = −93 dBm, i.e. 5 µV. This was confirmed again in Torremolinos in 1990.
  • The meter should behave as a quasi‑peak detector: rise time 10 ms ±2 ms, decay time constant at least 500 ms.

A little‑known fact: the recommendation says nothing about the bands from 30 to 144 MHz. So for 6 m and 4 m there is no “official” S9 and manufacturers do as they see fit.

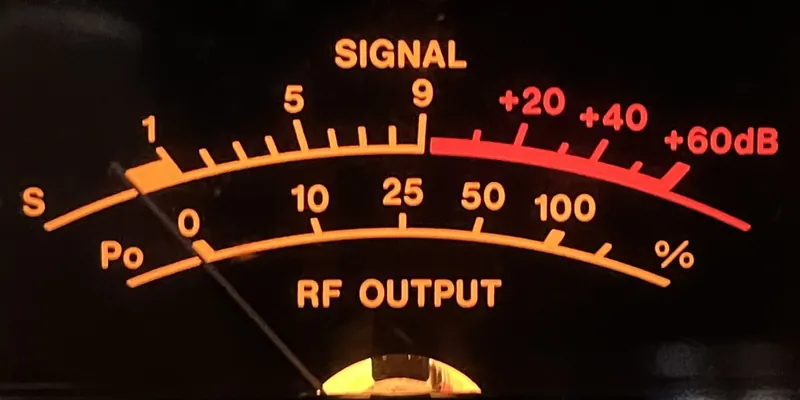
An Icom IC-732 S-meter lit in orange: upper SIGNAL scale from S1 to S9, then in red +20, +40 and +60 dB; lower output power scale
Icom IC-732 S‑meter: S1–S9, then +20, +40 and +60 dB · photo by Chaz360, CC BY-SA 4.0, Wikimedia Commons
6 dBper S‑point
−73 dBmS9 below 30 MHz
−93 dBmS9 from 144 MHz
10 / 500 msrise / decay

Slide the diagram sideways →

S scale on HF and VHF on a single dBm axis Top scale: HF, S1 is minus 121 dBm, S9 minus 73 dBm, S9 plus 60 is minus 13 dBm. Bottom scale: VHF from 144 MHz, shifted by 20 dB; S1 is minus 141 dBm, S9 minus 93 dBm. A minus 93 dBm signal is about S5.7 on HF, and exactly S9 on VHF. S1 S3 S5 S7 S9 +20 +40 +60 HF · below 30 MHz · S9 = −73 dBm S1 S3 S5 S7 S9 +20 +40 +60 VHF · from 144 MHz · S9 = −93 dBm −140 −120 −100 −80 −60 −40 −20 dBm −93 dBm: on HF ≈ S5.7 · on VHF S9
The same scale, shifted by 20 dB. A −93 dBm signal on 2 m is textbook S9, while on 20 m the same level would only give S5–S6. That’s why “S9 on the repeater” and “S9 on HF” are completely different signals.

Scroll the table sideways →

ReadingHF · dBmHF · µVVHF · dBmVHF · µV
S1−1210.199−1410.0199
S2−1150.398−1350.0398
S3−1090.793−1290.0793
S4−1031.58−1230.158
S5−973.16−1170.316
S6−916.30−1110.630
S7−8512.6−1051.26
S8−7925.1−992.51
S9−7350.1−935.01
S9+10−63158−8315.8
S9+20−53501−7350.1
S9+30−431 583−63158
S9+40−335 006−53501
S9+60−1350 059−335 006

Voltage across 50 Ω, RMS values. From S9 upwards there’s no “S10”: the scale goes in decibels above S9. You’ll find a quick cheat sheet with these numbers and a guide to hunting noise in the article about QRM interference.

Work it out yourself

S‑meter calculator

Enter any value: dBm, microvolts, watts or an S reading. The rest will convert itself, and the pointer will show where a perfect IARU S‑meter would sit. Switch HF to VHF and see the same signal ‘grow’ by three S‑points.

S‑meter: indication for the entered signal 1 3 5 7 9 +20 +40 +60 S dB kTB HF · S9 = −73 dBm SQ5CBA · SIGNAL
ReadingS9
Power−73.0 dBm
Voltage50.1 µV

The green kTB marker shows thermal noise in the selected bandwidth. On HF in an SSB filter it sits below S1, but switch to VHF and 12.5 kHz — it will sit around S2, just as the IARU predicts.

The slider and fields also work from the keyboard: the arrow keys step the level by half a decibel.

Enter a signal

Quick examples

Turn on JavaScript for live calculations.

Indicator, not a meter

Why the S‑meter lies

Most S‑meters in amateur radios aren’t calibrated and only show relative signal strength. The culprit isn’t the manufacturer or you, but the point in the receiver from which the indicator takes its reading.

Slide the diagram sideways →

Where the S‑meter sits in the receiver Receiver block diagram: antenna, attenuator, preamplifier, mixer with local oscillator, intermediate‑frequency filter, IF amplifier under automatic gain control, detector and speaker. The AGC loop runs from the detector back to the amplifier. The S‑meter is connected to the AGC voltage, not to the antenna, so the attenuator, preamp and filter bandwidth change its reading. antenna ATT attenuator PRE preamp MIX mixer FILTER IF · B AMP. IF + AGC DET detector AF local oscillator AGC voltage S-METER this is where you change the reading, even though the signal at the antenna is the same wider filter = more noise on the S‑meter The S‑meter reads the AGC, not the antenna
The receiver keeps the audio at the speaker roughly constant in loudness regardless of signal strength. It does this with automatic gain control (AGC). The S‑meter is essentially a voltmeter tied to the AGC voltage, so anything that alters gain along the way also changes the reading.
AGC

It measures the AGC, not the antenna

The reading depends on how much the receiver had to ‘turn itself down’. The AGC voltage vs signal is rarely exactly 6 dB per S‑unit.

PRE · ATT

Preamplifier and attenuator

Switch on the preamp and the same station suddenly shows two more bars. Nothing changed at the antenna. The attenuator does the opposite.

S1–S5

Compressed lower end of the scale

In HamSCI measurements three radios had about 5 dB per S‑unit over most of the scale, and below S3 only 2–3 dB. On one set the jump from S4 to S3 was 10 dB.

B

Filter bandwidth

Noise rises with bandwidth. Switch the filter from 500 Hz to 2.4 kHz and the noise alone on the S‑meter will jump by almost 7 dB, although the station hasn’t changed.

!

Radios are usually set so that S9 more or less agrees, and the further you are from that point, the greater the spread. That’s why the S-meter is great at showing changes on your station (this antenna better than that one, noise has gone up since yesterday), but it’s poor for comparisons with someone else’s radio. Want to give an honest report? Add context: “S7, preamp off”.

The floor under the S‑meter

Noise you can’t beat

Even a perfect receiver with a perfect antenna hears noise. What matters is not how strong the signal is, but how far it stands above that noise.

kTB, i.e. thermal noise

Every resistor at room temperature makes noise. The power of that noise is k·T·B: Boltzmann’s constant times temperature times bandwidth. For 290 K it comes to −174 dBm per hertz of bandwidth. Nothing goes lower.

Filter width matters, because noise integrates over the whole bandwidth. A filter ten times wider means 10 dB more noise. That’s why a weak CW station, inaudible in an SSB filter, suddenly pops up when you switch in a 500 Hz filter.

IARU has noted alongside the S scale that a properly calibrated S‑meter on VHF should on thermal noise alone show about S2 in a 3 kHz bandwidth and S3 in a 12 kHz bandwidth. If yours sits on zero, its scale is shifted low.

BandkTBPurpose
1 Hz−174.0 dBmreference point
500 Hz−147.0 dBmnarrow CW filter
2.4 kHz−140.2 dBmtypical SSB filter
3 kHz−139.2 dBmwide SSB, narrow AM
12.5 kHz−133.0 dBmnarrow FM, repeaters

On top of that you have the receiver’s own noise (noise figure, NF) and the noise picked up by the antenna from the environment.

Environmental noise above thermal noise Bar chart per ITU‑R P.372. Median man‑made noise in a residential area: 160 m 65 dB above kTB, 80 m 57 dB, 40 m 49 dB, 20 m 41 dB, 10 m 32 dB, 2 m 13 dB. In a quiet rural area it is 46, 38, 29, 21, 12 dB respectively, and on 2 m the environmental noise drops below thermal noise. 0 10 20 30 40 50 60 70 dB above kTB 65 46 160 m 1.8 MHz 57 38 80 m 3.6 MHz 49 29 40 m 7.1 MHz 41 21 20 m 14.2 MHz 32 12 10 m 28.5 MHz below kTB 13 2 m 144.3 MHz residential area quiet rural area
This is what environmental noise looks like per ITU‑R P.372 (median, measurements from the 1970s). On 80 m in a residential area the noise coming in via the antenna is over 50 dB above kTB — in the SSB bandwidth that’s about S7. On 2 m in a residential area it’s only a dozen or so decibels, and in a quiet rural area it’s below the receiver’s own noise.

What this means in practice

  • On 160 and 80 m a preamp usually does nothing for you. Noise from the antenna is tens of decibels above the radio’s own noise, so the preamp raises both. It’s often better to switch in the attenuator: the noise will drop just like the signal, and the receiver gains more headroom for strong stations.
  • On 2 m and 70 cm the receiver’s own noise matters. Here external noise is low, so every decibel of noise figure counts, and a preamp at the antenna can make a difference.
  • A narrow filter is free decibels. Going from 2.4 kHz to 500 Hz gives nearly 7 dB less noise for a CW signal — more than doubling the power at the other end.
  • ‘S5 noise’ is a report too. If the other station says you’re S5 and he has S7 noise, he can’t hear you. It’s the signal‑to‑noise that counts, not the S‑unit reading.
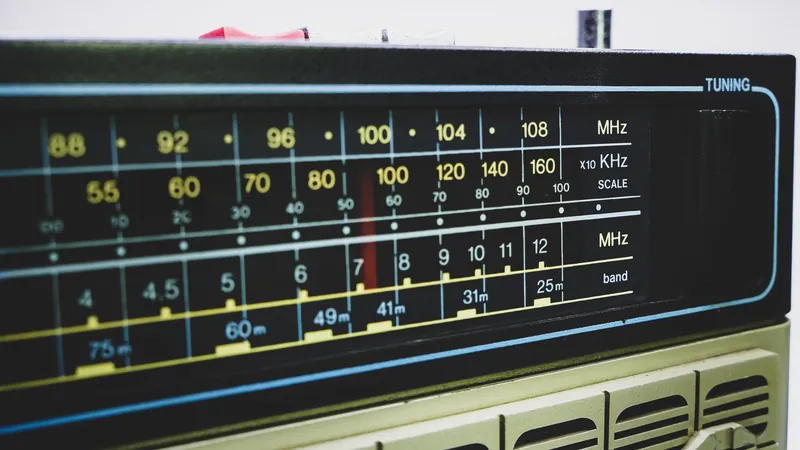
Receiver tuning scale with shortwave broadcast bands 75, 60, 49, 41, 31 and 25 metres and the VHF 88–108 MHz band Receiver scale with shortwave broadcast bands: 49, 41, 31 and 25 m
Power, antenna, cable

How many S‑points will I gain?

The most common forum question: is it worth buying an amplifier? The answer always starts with decibels. Enter the power before and after, and the change in antenna gain, and you’ll see how many S‑units that is at the other station.

+13.0dB +2.2S‑points

From 5 W to 100 W is +13.0 dB, which is about 2.2 S-points.

5 W → 100 W

+13 dB ≈ 2.2 S

Twenty times more power, and at the other station it goes from S5 to S7. Noticeable, but no miracles — for a nearby repeater a handheld on its own is often enough.

100 W → 1 kW

+10 dB ≈ 1.7 S

Ten times more current, heat and costs for not quite two S-points. Worth it when you’re chasing distant stations on the edge of audibility, not for everyday chats.

dipole → Yagi

+6 dB = 1 S

A directional antenna with 6 dBd gain gives the same as quadrupling the power, and it also improves reception. An amplifier can’t do that. Work yours out in the antenna calculator.

Readability · Strength · Tone

The RST report

The system was devised in 1934 by American radio amateur Arthur W. Braaten, W2BSR. Three digits: readability from 1 to 5, strength from 1 to 9 and tone from 1 to 9. Tone is judged only in telegraphy and digital modes, so on phone you give two digits: “five nine”.

R · readability
S · signal strength
T · tone
Suffix
Telegraphy report · RST
599
  • R5 perfectly readable
  • S9 exceptionally strong
  • T9 ideal, without a trace of ripple or modulation

R · readability

1unreadable
2barely readable, occasional words
3readable with considerable difficulty
4readable with practically no difficulty
5perfectly readable

S · strength

1faint, barely perceptible
2very weak
3weak
4fair
5fairly good
6good
7moderately strong
8strong
9extremely strong

T · tone (CW)

1mains hum, very rough and broad
2very rough, harsh and broad
3rectified but unfiltered
4rough, with a trace of filtering
5filtered, heavily modulated by ripple
6filtered, pronounced trace of ripple
7nearly pure, slight ripple
8almost ideal, slight trace of modulation
9ideal tone

The “599” culture

In contests the report is a formality. It’s all about speed and the serial number, so almost everyone gives 599 or “five nine”, and CW operators shorten it to 5NN, because the letter N sends faster than a nine. Nobody treats it as a measurement and there’s nothing wrong with that — those are the rules of the game.

Outside contests a report only makes sense when it’s true. The other station may be testing an antenna, checking a new amplifier or just wanting to know whether they’re being heard well. “Five nine” for a signal barely above the noise tells them nothing.

Letters after the report describe what the digits don’t. A means aurora and replaces the tone digit, also on phone: an auroral report would be e.g. 57A or 55A, because instead of a clean tone you hear noise keyed to the rhythm of the characters. C is chirp, i.e. frequency swing on keying, K key clicks, and X exceptionally stable frequency. For propagation phenomena such as aurora, IARU Region 1 has recommended adding letters to the report since 1999, because such reports are useful in propagation studies.

How to give an honest report

  • Set R by ear. Do you copy every word? That’s a 5, even with a weak signal.
  • Read S with the preamp in a fixed position and say whether it was on.
  • Give the noise. “S5 with S3 noise” says more than S5 alone.
  • On a repeater S refers to the repeater, not the other station. You judge their signal by the modulation and background noise.
  • In contests — 599 and that’s the end of it.
Fifteen minutes at the bench

Check your S-meter

You don’t need a laboratory. A signal generator with a known output level and a step attenuator are enough. If you don’t have them, borrow from the club — the result will stay with you for years.

Slide the diagram sideways →

S-meter test setup A signal generator set to −33 dBm connected by a cable to a step attenuator set to 40 dB, which in turn is connected to the transceiver’s antenna socket. −73 dBm reaches the radio input, so on HF the S‑meter should show S9. GENERATOR 14.100 MHz −33 dBm RF OUT STEP ATTENUATOR 1 dB 2 dB 4 dB 10 dB 20 dB 20 dB total: 40 dB TRANSCEIVER S9 AGC on · PRE off · ATT off −33 dBm − 40 dB = −73 dBm → on HF it should be S9
The generator gives a known level, the attenuator subtracts exactly as many decibels as you set. Level at the radio input = generator level − attenuation. By changing the attenuator in 6 dB steps, you step through each division of the scale.
1

Set the generator

An unmodulated carrier in the band you want to check, for example 14.100 MHz. Output level known, preferably measured, e.g. −33 dBm.

CW · unmodulated · level known to within 1 dB
2

Set up the radio

AGC on, because without it the S‑meter in most radios doesn’t work at all. Preamp and attenuator in the radio off. Note the filter bandwidth.

3

Go down in 6 dB steps

Start with the attenuation that gives S9+40, then add 6 dB at a time and write down the reading after each step. This way you’ll see where the scale is compressed.

−33 dBm − 40 dB = −73 dBm → S9 on HF
4

Repeat with the preamp

The same series with the preamp on, then on another band. The reading can differ between bands.

5

Stick the cheat sheet up

Print the table and keep it by the radio. From now on, “S7” at your station has a specific value in dBm, and comparing two antennas stops being a guessing game.

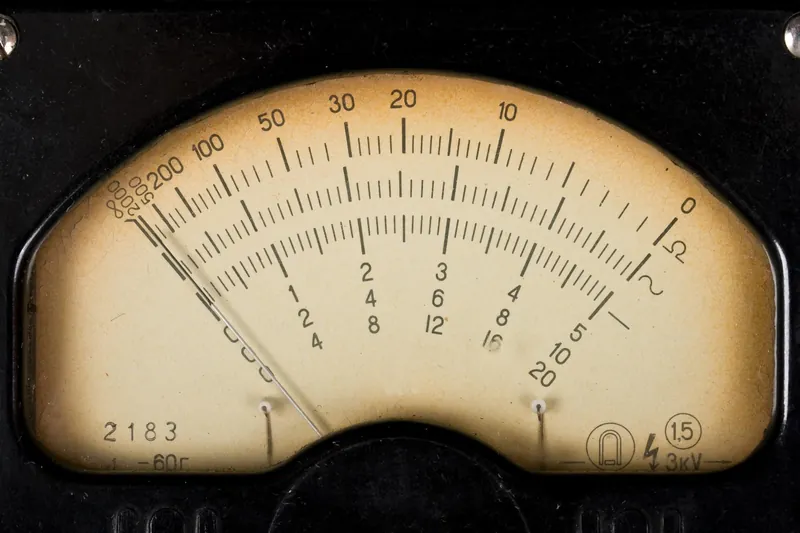
Old laboratory meter with a cream dial and several curved scales, including a decibel scale; the needle is at the left end Old laboratory meter: each scale has its own reference point
ReadingIARU · HFYour radiowith PRE
S9+40−33 dBm……
S9+20−53 dBm……
S9−73 dBm……
S7−85 dBm……
S5−97 dBm……
S3−109 dBm……
S1−121 dBm……

On 2 m subtract 20 dB from the IARU column (S9 = −93 dBm).

≈

No generator? An SDR receiver won’t help straight away either: most programs show dBFS, i.e. level relative to the converter’s full scale, not dBm. To have an SDR speak in dBm, you must calibrate it first — with that same generator.

Cheat sheet

Measurement glossary

dBm
Power relative to 1 mW. 0 dBm = 1 mW, −73 dBm = S9 on HF.
dBµV
Voltage relative to 1 µV. On 50 Ω: dBm = dBµV − 107.
dBi · dBd
Antenna gain relative to an isotropic antenna or a dipole. 0 dBd = 2.15 dBi.
ARW · AGC
Automatic gain control. The S‑meter reads the AGC voltage.
PRE · ATT
RF preamp and input attenuator. They change the S‑meter reading, not the signal at the antenna.
kTB
Thermal noise: −174 dBm/Hz at 290 K. The lower limit of any reception.
NF
Receiver noise figure: by how many dB it is noisier than an ideal one.
dBFS
Level relative to the full scale of the converter in an SDR. It’s not dBm.
R.1
IARU Region 1 recommendation from 1981: 6 dB per division, S9 = −73 dBm (HF) and −93 dBm (from 144 MHz).
5NN
Shortened 599 in CW contests. N is sent faster than 9.

Sources

  1. IARU Region 1, VHF Managers Handbook, chapter “Technical Recommendations”, B.1 Signal reporting (R.1, R.2) — PDF
  2. Wikipedia, S meter and R-S-T system
  3. HamSCI, S-Meter Calibration — method and measurements for TS-180, FT-747, OMNI-VI
  4. G7IZU, Auroral propagation — examples of reports with the “a” suffix (52a, 55a); N1BUG, Aurora — the sound of a CW signal in aurora
  5. ITU-R P.372-13, Radio noise, table 1 (industrial noise constants c and d) — ITU
Next step

You’ve got the numbers. Find the noise.

Now that you know what S7 is, check where the noise on your band comes from and how to track it down with a single switch.